
Which websites do you visit most? Browsing history analytics for Chrome
Chrome doesn't show statistics about your browsing. See your most visited sites, domain share, daily activity and busiest hours — calculated privately on your own device.
How much of your day goes to email, news or video? Which sites do you really open most? Chrome's History page can't tell you: it's a plain list with no counts, charts or totals. The New Tab page shows a few shortcuts, but not numbers.
What you can learn from your history
A few weeks of browsing history says a lot:
- Your top sites — often a surprise. Many people find one or two sites take a third of all visits.
- When you browse — early-morning reading, a late-night video habit, a busy Monday.
- Trends — whether a new project, a trip or a habit change actually shows up in what you do.
Browsing analytics in Browser History+
Browser History+ has an Analytics tab that turns your saved history into charts. Everything is calculated inside your browser from your own local data; nothing is uploaded.
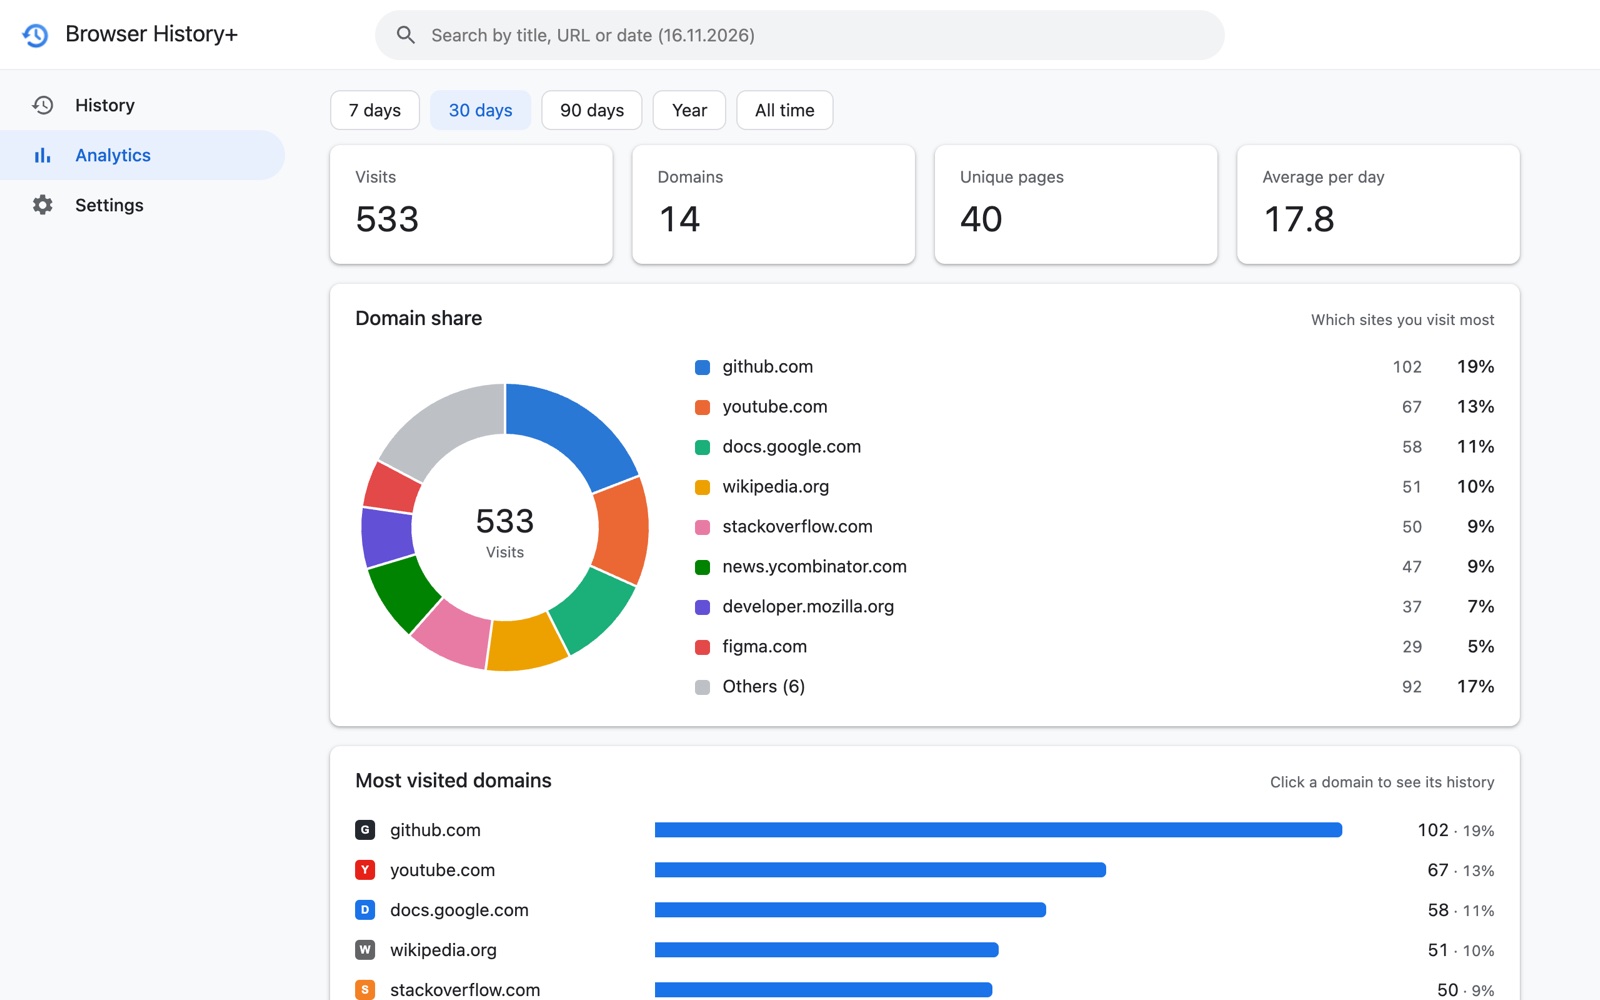
Choose a period
Pick 7 days, 30 days, 90 days, Year or All time. Because Browser History+ keeps its own copy with no 90-day limit, "Year" and "All time" really mean that — as long as the extension was installed.
Summary tiles
Four numbers at the top: total visits, number of domains, unique pages and the average visits per day for the period.
Domain share (donut chart)
A donut chart shows how your visits split between your top 8 sites, with everything else grouped as Others. Hover a slice or a legend row to see the exact count and percentage. Click a site to jump to all of its visits in History.
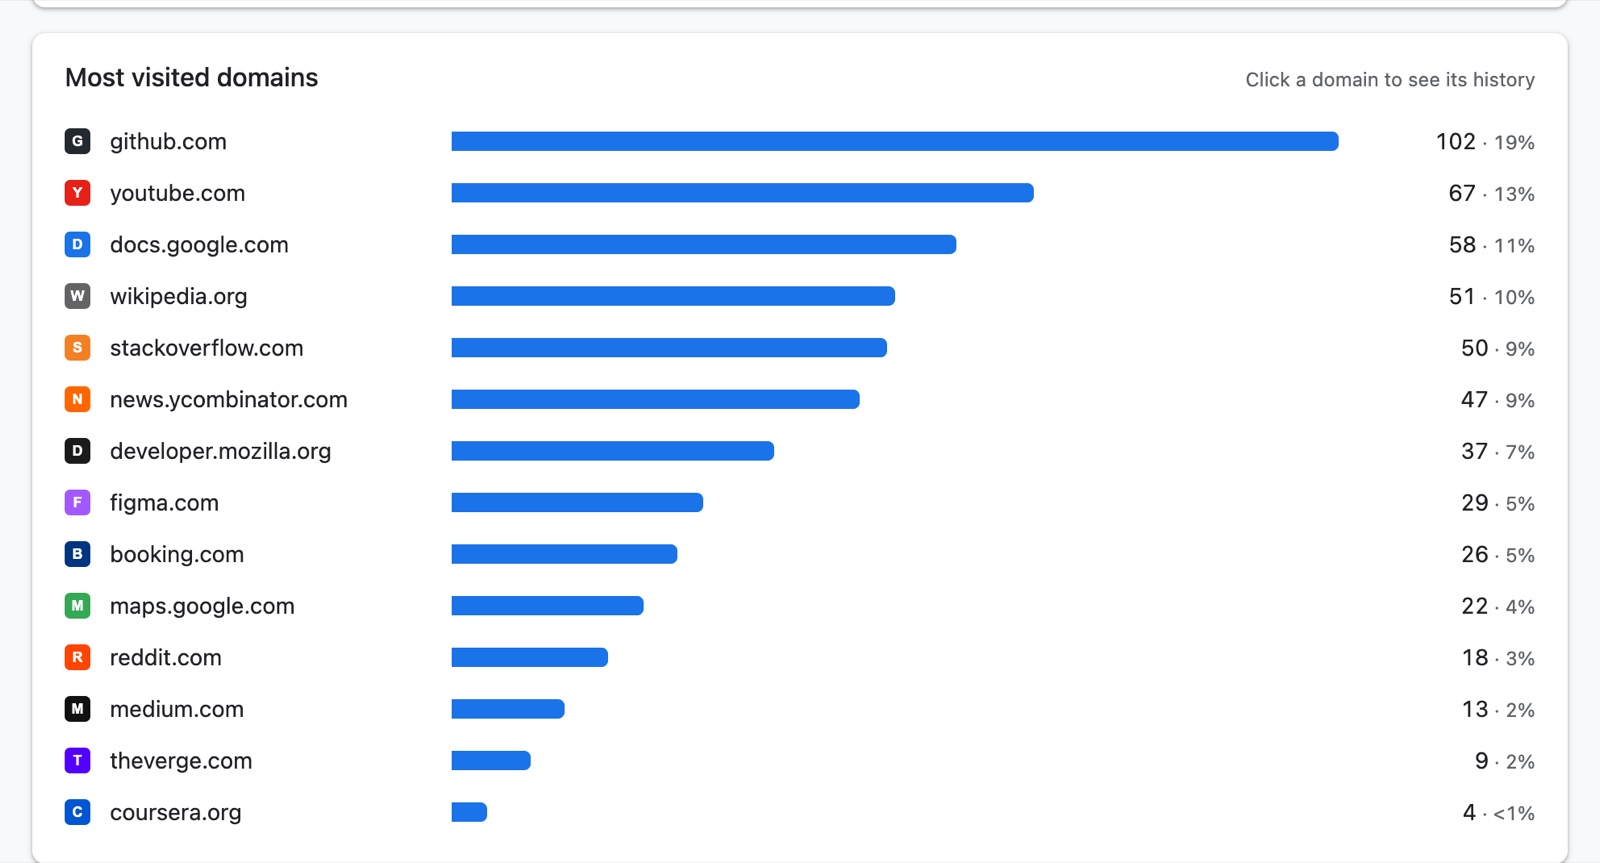
Most visited domains
A ranked bar chart of your 15 most visited sites, with site icons, visit counts and their share of the total.
Activity over time
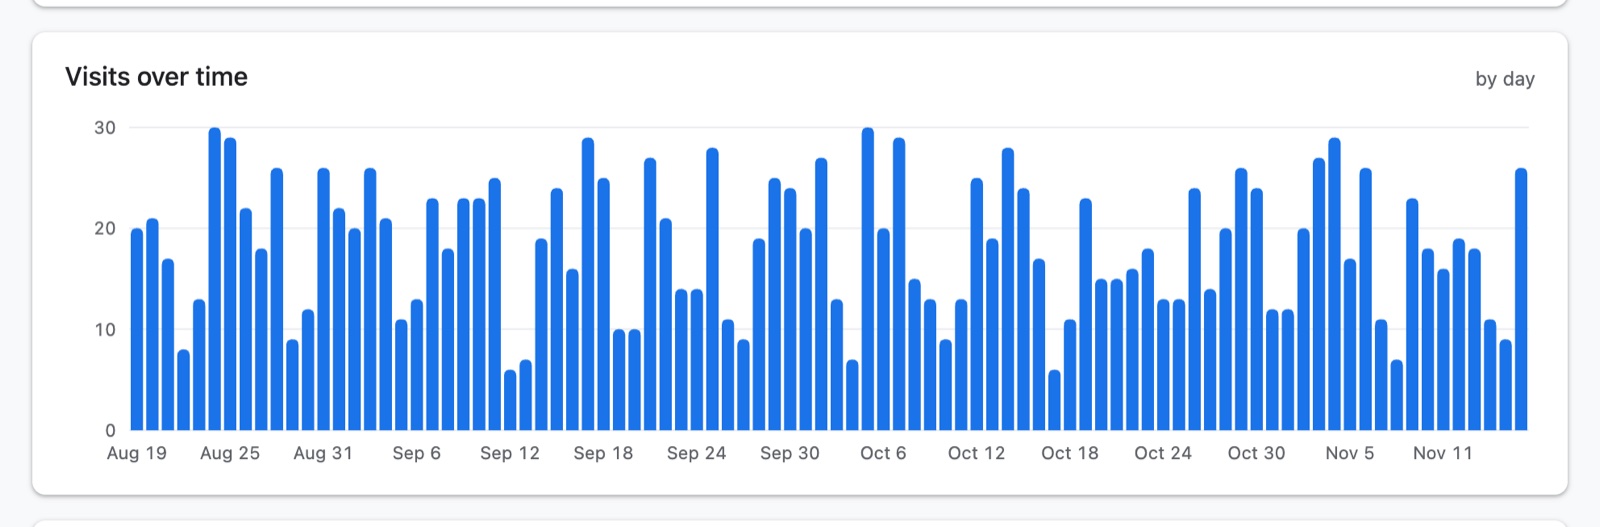
A column chart of visits per day. For longer periods it switches to weeks (up to two years) and then months, so the chart stays readable. Click a day to open that day's history.
Activity by hour
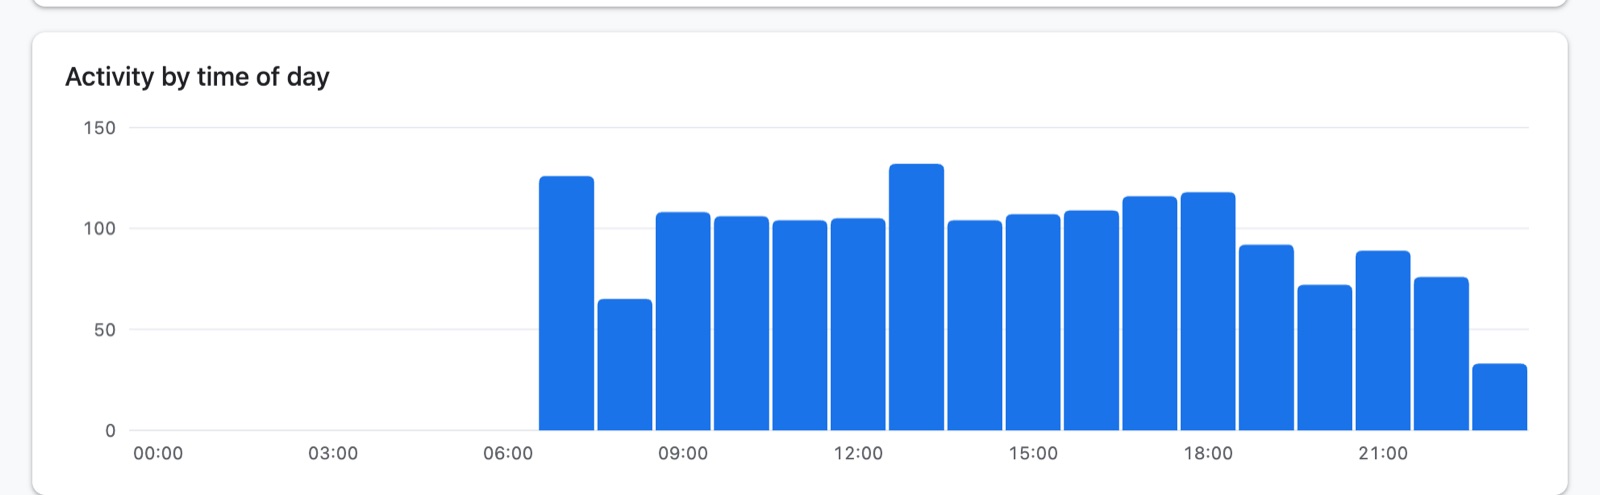
Visits for each hour of the day, 0–23, for the selected period — a quick picture of when you're most active online.
Ideas for using it
- Digital wellbeing: check your top sites for the last 30 days and decide what deserves less time.
- Timesheets and reports: see which tools and documents you used on a given day, then open the day's history for detail.
- Find "that site": if you remember you visited a site a lot last month but not its name, the top-domains list usually shows it.
A note on what the numbers mean
Analytics count visits — each time a page was opened — not minutes spent on a page. A site you keep open all day in one tab counts as few visits, while quick checks of email count as many. It's a picture of habits, not a stopwatch.
Frequently asked questions
How do I see my most visited websites in Chrome?
Chrome doesn't show visit counts. Browser History+ adds an Analytics tab with your top 15 domains, a domain-share donut chart and activity charts for 7 days to all time.
Does browsing analytics send my data anywhere?
Not in Browser History+. The charts are calculated locally in your browser from the history stored on your device. There are no servers or analytics services involved.
Does it measure time spent on websites?
No. It counts visits, which shows how often you open each site and when you're most active, but not how long a page stays open.